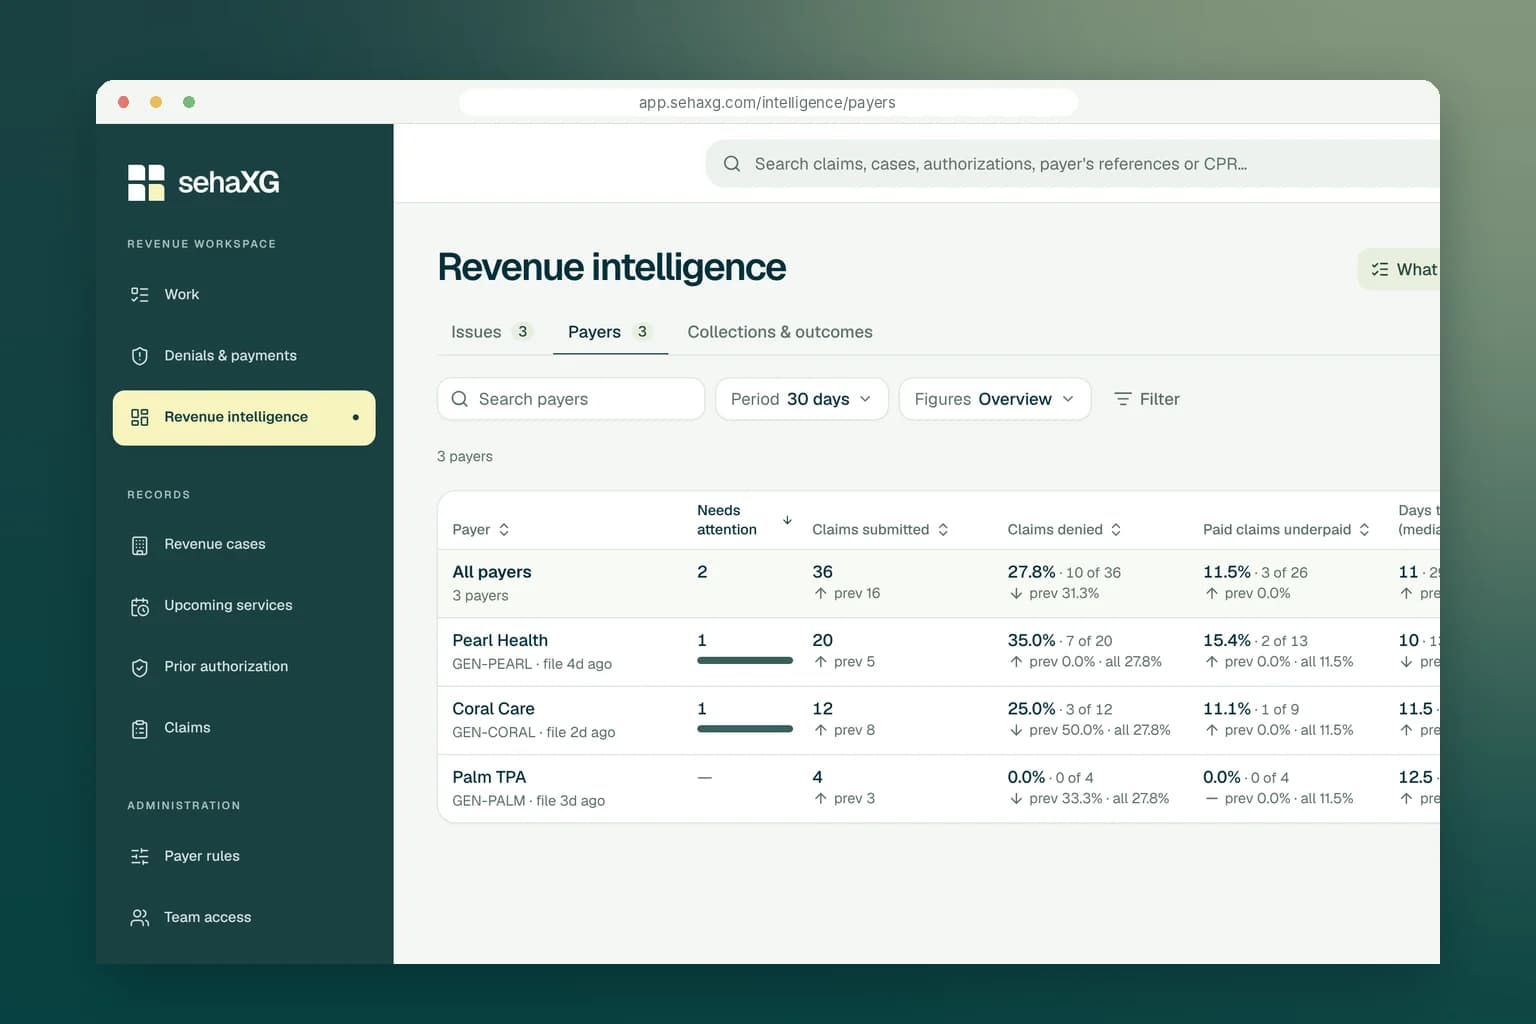
Insurer behaviour is visible in the decisions and payments made on claims. A change may be legitimate, an internal data problem or an emerging reimbursement issue. Revenue-cycle teams need a baseline for each insurer and service, a way to test whether the pattern is real, and a clear route from finding to action.
01 / WHAT CAN CHANGE
Look beyond a single denial percentage
Useful signals include denial rate by reason, requests for additional records, prior-approval response times, payment lag, allowed amount versus contract, partial payments and A/R aging. Track them by insurer and plan rather than combining all payers into one average. A plan mix change can make a payer look worse or better even if its processing stayed the same.
Distinguish technical rejections from adjudicated denials and payment variances from legitimate patient share. A new denial code might reflect a changed submission format, while a longer time to payment could be caused by a backlog of unmatched remittances in the hospital. The first task is to establish what actually changed, for which claims and at which step.
- Before payment: acceptance, approval questions, denial reasons and documentation requests.
- At payment: adjudication time, allowed amount, insurer share and adjustments.
- After payment: unresolved balances, reversals and appeal outcomes.
02 / THE COMPARISON
Compare the same kind of claims over time
Define a payer, plan, service family and period. Count submitted and adjudicated claims separately, then calculate a rate using the right denominator. If denial counts rose from 20 to 30 while volume doubled from 500 to 1,000, the rate fell from 4% to 3%; the count alone would tell the wrong story. Compare service dates and insurer response dates when a policy change may have occurred between them.
Segment further when facility, provider, coding mix or contract version changed. A new high-complexity service may naturally have different documentation needs. Use a stable comparison group where possible and show sample size; a move from one denial to two is a 100% increase but weak evidence of a systemic payer shift. Keep the method simple enough for a contract or operations lead to verify.
03 / CLAIM REVIEW
Read the claims behind the chart
Pull a sample of affected claims and a sample that paid normally. Compare service, plan, approval, submitted data, insurer wording and contract term. Ask whether one internal process changed at the same time: a software release, a new billing team, a missing attachment or an expired approval. An insurer problem and an internal problem can produce the same dashboard spike.
Mark each sampled case as confirmed payer issue, confirmed internal issue, legitimate contractual outcome or unresolved. Do not generalise the entire cohort from two dramatic examples. If the cases have different causes, split the pattern and give each subgroup its own remedy. A trustworthy finding reports the exceptions, not only the claims that support the headline.
04 / WORKED SCENARIO
A new documentation denial across one service
Imagine a Bahrain clinic submits 200 claims for an imaging service to one insurer in each of two months. Documentation denials rise from four to 22. That is a move from 2% to 11% with a stable denominator, so it deserves review. Ten sample claims show the same attachment was present in the clinical record but absent from the insurer submission; five show genuinely incomplete notes and seven need further investigation.
The first group calls for a submission hand-off fix and permitted corrections. The second needs clinical documentation review before any appeal. The unresolved group should not be included in a claimed recoverable BHD total yet. Only if valid, complete claims continue to be denied after the hand-off is repaired should the team present the insurer with a focused sample and ask whether its rule or processing changed.
22 denials, more than one cause
One payer trend can contain internal omissions, legitimate denials and disputed decisions. Each subset needs different evidence and a different owner.
See why the 22 denials are not one problem
sehaXG can show the clinic's jump from four to 22 documentation denials by insurer and service, then open the affected claims with their submission and clinical-evidence status. The team can separate claims whose attachment never reached the payer from claims that need a clinician's note and cases still awaiting an insurer explanation.
Each subgroup gets its own next step and owner. After the attachment hand-off is fixed, sehaXG can compare new claims with the same baseline and show whether the specific denial pattern fell, rather than treating a generic payer alert as a finished investigation.
Explore sehaXG Intelligence05 / BHD AT RISK
Separate exposure from valid recovery
Calculate the expected insurer share only for claims that appear otherwise payable under the relevant agreement. Remove duplicates, patient responsibility and claims already corrected or paid. Report potential BHD at risk, validated disputed BHD and cash recovered as separate values. If the problem mainly delays payment, show aging and time-to-payment rather than calling the full claim value a permanent loss.
Staff effort also matters. An insurer's new documentation request can consume clinician and biller time even when every claim eventually pays. Estimate that burden using observed touches or minutes per case, not an invented productivity percentage. A credible impact statement tells leaders whether the response should be an internal process change, a payer discussion or both.
06 / ACTION PATH
The remedy follows the cause
If claim data is wrong, correct it through the insurer's permitted route and fix the upstream source. If an approval exists but its reference was lost, repair that hand-off. If the contract appears to support a different payment, assemble a line-level calculation and request review. If payer guidance is ambiguous, seek written clarification before turning a hypothesis into a bulk appeal.
For an insurer conversation, bring a defined cohort, the relevant clause or policy, representative claims, the BHD calculation and one specific request. Avoid a generic complaint that the payer's denial rate is high. Record the insurer's response and the deadline for reprocessing or rule clarification. A meeting is not a resolution until the claim-level outcomes change.
07 / FEEDBACK
Keep watching after the first correction
After a claim edit, training change or payer decision, compare a later cohort with the original one. Did the specific denial reason fall, or did it move to another code? Did median payment time improve? Were corrected claims actually paid? Keep the denominator and service mix visible. A reduction in the number of denials can be caused by fewer submissions rather than a better process.
Review false alerts and missed patterns as well. If a model repeatedly flags ordinary monthly variation, staff will stop trusting it. If it misses a small but repeated BHD 7 variance, the team may lose a material opportunity at scale. The monitoring process should help people ask better questions, not generate an endless stream of unowned notifications.
08 / OPERATING PRACTICE
Give payer review a monthly owner
A monthly payer review can examine the largest changes by insurer, plan and service; select a few that pass validation; and assign a named owner to investigate. Include revenue operations, contracting and clinical documentation when their decisions affect the answer. Keep a log of questions asked of the insurer, decisions received and rule versions adopted by the hospital.
The output should be a short list of verified actions, not a long slide deck of every metric. Escalate urgent filing or appeal deadlines outside the monthly cadence. Over time, the history becomes evidence for annual insurer discussions and shows whether the same issue keeps returning despite earlier agreements.
THE NEXT STEP
A payer trend is a question to investigate
The useful sequence is compare, inspect, quantify and respond. sehaXG is designed to keep the payer pattern connected to the claims and people who can act on it, then show whether the response changed payment or workload.